API SECURITY & FULL-STACK ENGINEERING2026
SentinelAPI
Evidence First
I built an API security monitoring prototype that turns WSO2 gateway activity into stored telemetry and explainable alerts, alongside controlled machine-learning experiments and a React investigation dashboard.
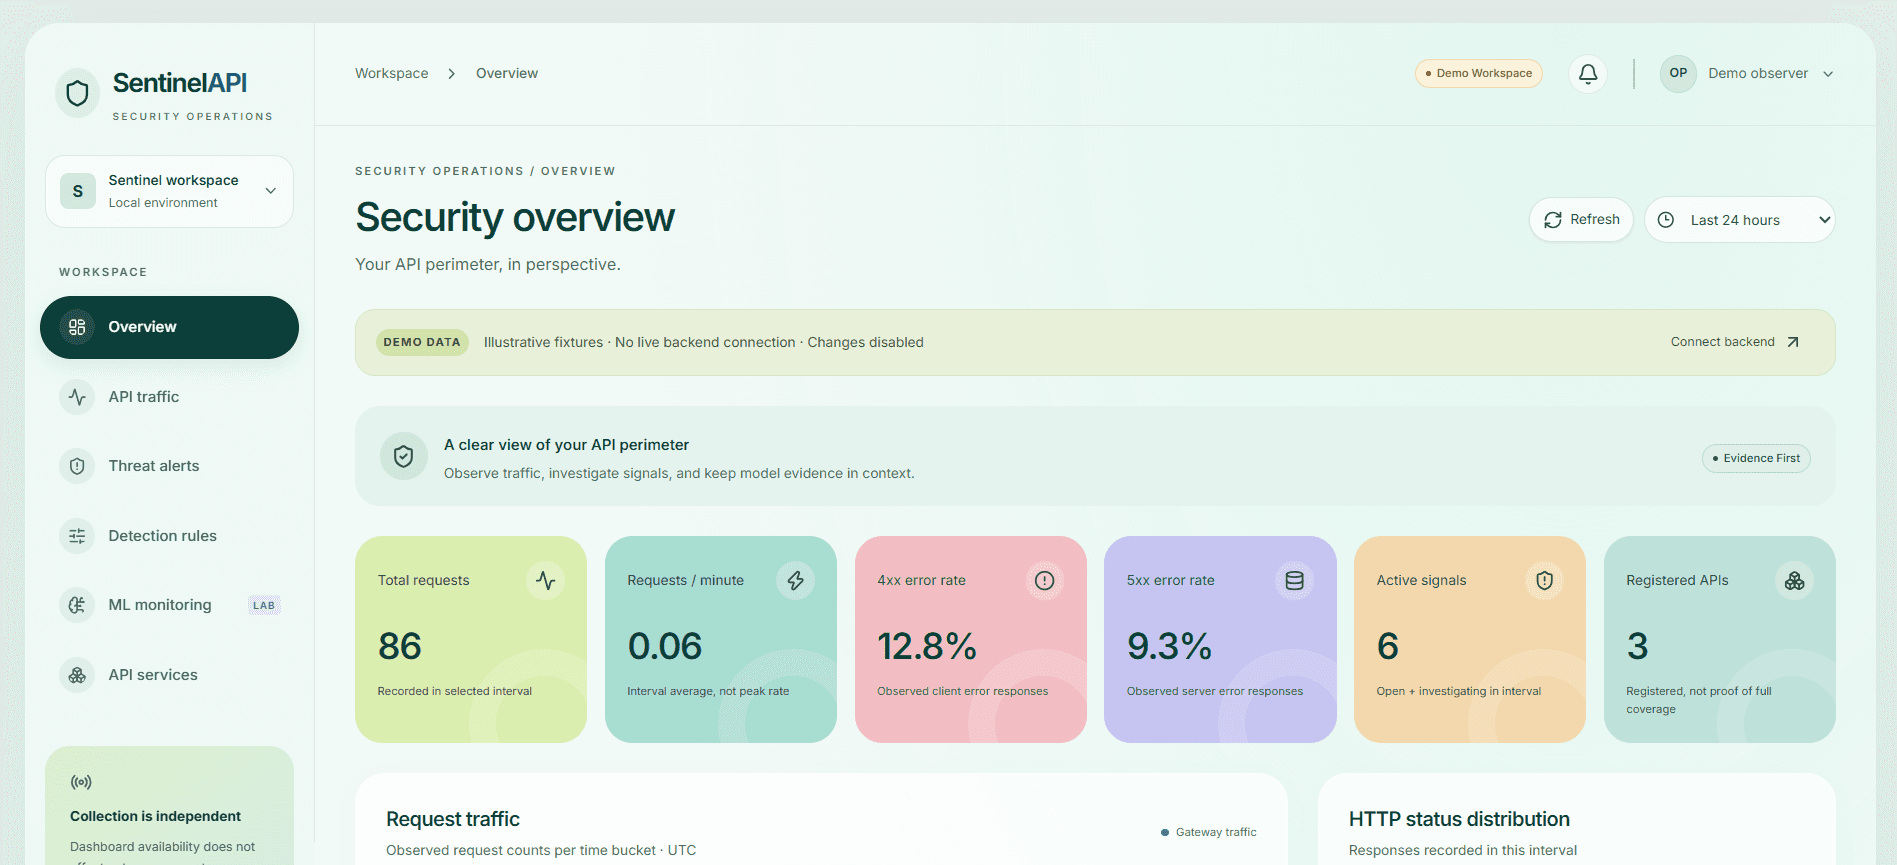
Dashboard preview uses labeled demo fixtures with no live backend connection. Runtime findings come from controlled local validation; ML results come from synthetic offline evaluation, not production attack-detection accuracy.
PROJECT CONTEXT
An HTTP 200 confirms a successful request, but says little about patterns across an API. SentinelAPI complements gateway enforcement by collecting request outcomes and evaluating them asynchronously, outside the live request path.
The project connects a FastAPI sample backend and WSO2 API Manager to a Python log bridge, collector, PostgreSQL database, detection worker, authenticated monitoring API, and React dashboard.
Separate enforcement from monitoring. Normalize sanitized gateway events, persist them with replay protection, and link each detection result to the observations that support it.
WHAT I DID
My contribution from concept to working experience.
I worked across the gateway integration, backend pipeline, persistence, detection logic, ML evaluation, and monitoring interface to verify the complete workflow.
Gateway integration
Registered DemoCommerceAPI in WSO2 and verified OAuth rejection, authorized routing, and 10PerMin throttling through controlled requests.
Reliable telemetry
Built a bounded host log bridge and collector with sanitization, checkpoints, and database uniqueness constraints to support recovery and replay.
Explainable detection
Implemented API-level sliding-window error-rate detection with linked evidence, transactional checkpoint advancement, and incident deduplication.
ML and dashboard
Evaluated Isolation Forest on 180 synthetic traffic windows and built React views for traffic, alerts, rules, services, and ML monitoring.
HOW I BUILT IT
A deliberate build process,
step by step.
Verify the gateway
Establish the client-to-gateway-to-backend path and observe HTTP 401, 200, and 429 behavior.
Connect the pipeline
Transport gateway logs into a shared spool, normalize completed events, and verify durable PostgreSQL records.
Detect with evidence
Evaluate five-minute windows with at least 20 requests and an error ratio above 50%, preserving supporting events.
Evaluate and present
Compare rules and ML on controlled synthetic data and present monitoring information with clear demo, empty, and failure states.
CORE FEATURES
- OAuth 2.0 and gateway throttling validation
- Sanitized gateway-event collection
- Checkpoint recovery and replay deduplication
- Asynchronous API-level error-rate detection
- Alerts linked to underlying event evidence
- Authenticated monitoring and security APIs
- Role-based reader, analyst, and administrator access
- Isolation Forest offline experimentation
- React dashboard with explicit demo states
TECHNOLOGY
WSO2 API Manager 4.5PythonFastAPIPostgreSQL 17SQLAlchemyAlembicIsolation ForestReactTypeScriptViteDocker Compose
Explore source code PROBLEMS I SOLVED
A healthy gateway, an unhealthy pipeline
Traced missing telemetry across collector health, Docker mounts, spool contents, and checkpoints. Restarting the host bridge restored fresh input; the collector committed 54 events and database verification showed 75 persisted gateway records at that stage.
Successful migrations, outdated schema
Found that the migration image predated newer Alembic files. Rebuilding it and applying the remaining migrations brought the schema to the expected revision while preserving the existing telemetry.
Keeping conclusions within the evidence
Enabled only API-level error-rate detection for the available BASIC telemetry. Client-specific rules remain disabled until trustworthy identity and classification inputs are available. Synthetic ML scores are presented as experimental signals.
A verified local workflow from gateway events to a persisted error-rate alert with 16 evidence links, supported by a monitoring interface and controlled ML experiments.
Go behind the build.
Read the full engineering story, with gateway configuration, database evidence, and the controlled ML evaluation charts.